
Figure 3.
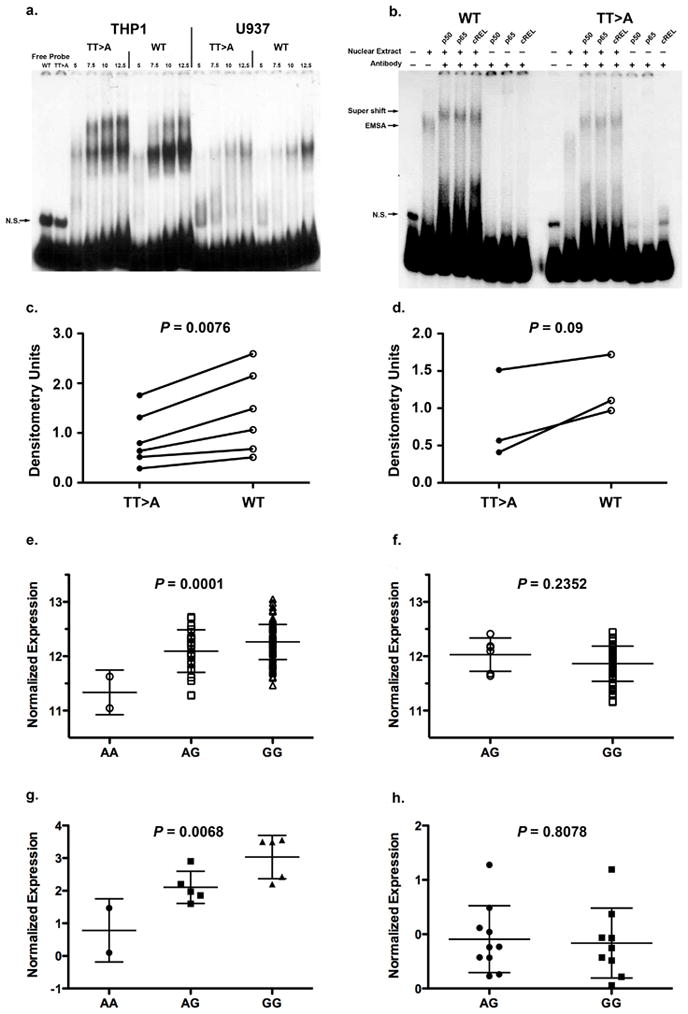
Functional characterization of the TT>A polymorphic dinucleotide and TNFAIP3 associated risk haplotype. (a.) Shown is a representative EMSA result from six independent experiments for THP1 and three for U937). The first two lanes show free probe for wild type (WT) and TT>A variant followed by increasing amounts of nuclear protein and labeled probes as indicated. A non-specific band is labeled N.S. (b.) Super shift was performed using antibodies specific to NF-κB subunits.. Complexes formed in the presence and absence of antibodies are identified by arrows on the left of the figure.. Densitometric quantification of nuclear protein binding in independent experiments was performed for THP1 cells (c.) and U937 cells (d.) using optimal concentrations of nuclear extract. Expression of TNFAIP3 transcripts were evaluated from CEU, CHB and JPT populations (AA, N=2; AG, N=24; GG, N=115) (e.) and compared to the YRI population (AG, N=6; GG, N=54) (f.) using a one-way ANOVA and unpaired t-test. A20 protein expression from cell lines of European-ancestry subjects (AA, N=2; AG, N=5; GG, N=5) (g.) were compared to African-American subjects (AG, N=10, GG, N=9) (h.) using one-way ANOVA and unpaired t-test, respectively.