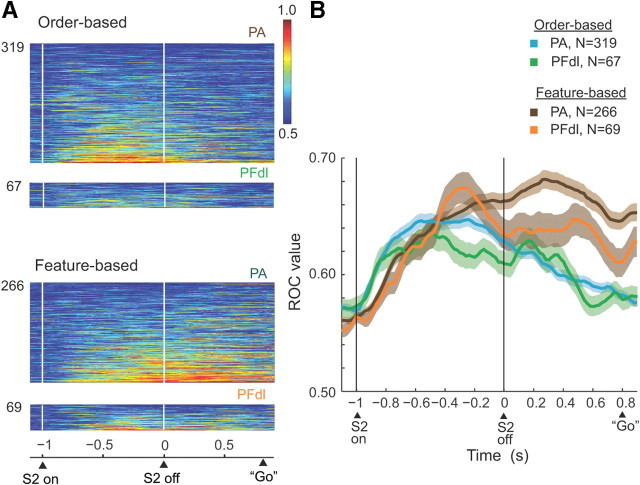
Figure 10.
Results of ROC analysis. Bin of 200 ms, with 20 ms steps. A, ROC plots for neurons with significant relative-distance coding, with the area under the ROC curve color-coded for each cell and ranked according to mean ROC values. B, Time course of changes in mean ROC values. Background shading indicates one SEM. Only trials with an 800 ms D2 period were used.

