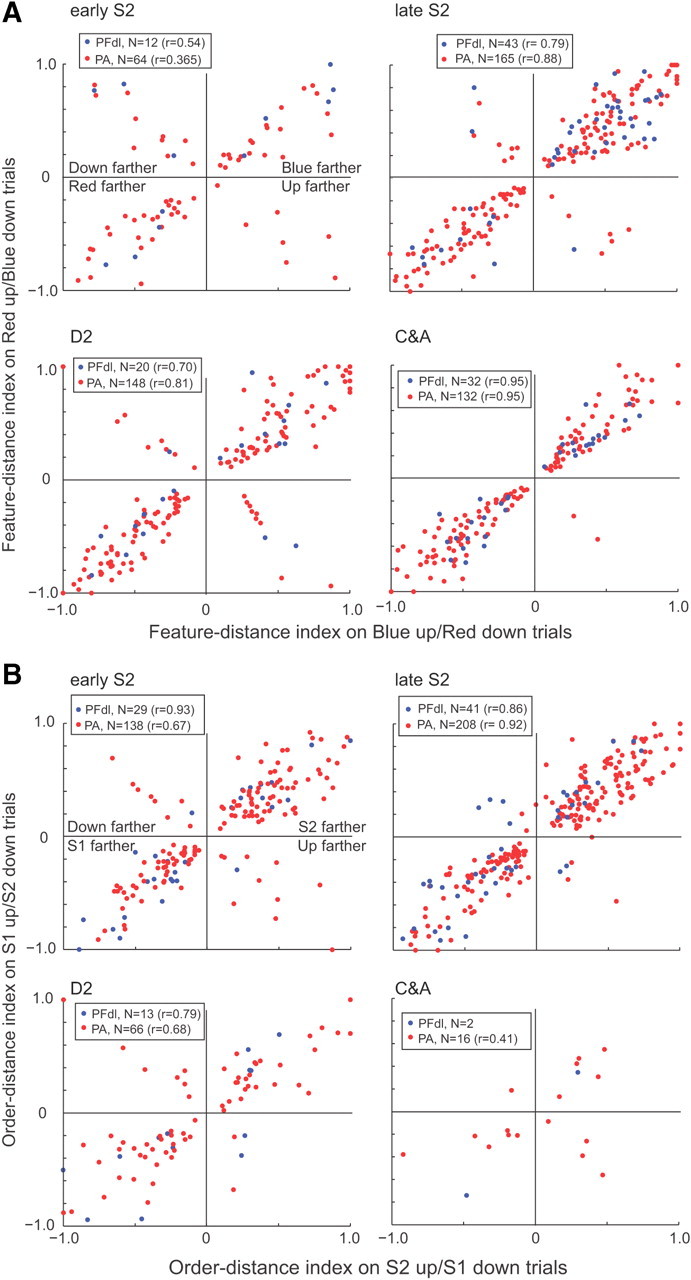
Figure 6.

Abstract relative-distance tuning. A, A feature-distance index varied from −1.0, which indicated complete selectivity for trials in which the red stimulus appeared farther from the reference, to +1.0, which indicated complete selectivity for trials in which the blue stimulus appeared farther, with 0.0 indicating no selectivity. For most cells, the selectivity for blue-farther trials changed little when the blue circle had appeared above the reference (abscissa) or below the reference (ordinate) (461 of 509, 90.1%, in PA; 98 of 107, 91.6%, in PFdl). A minority of cells showed a preference for the downward stimulus (top left quadrant) or upward (bottom right quadrant) being farther (48 of 509, 9.4%, in PA; 9 of 107, 8.4%, in PFdl). B, As in A but for the order-distance index. Order-distance coding changed little based on stimulus position (391 of 428, 91.3% in PA; 75 of 85, 88.2%, in PFdl). A minority of cells coded whether the upward stimulus (bottom right quadrant) or downward stimulus (top left quadrant) had been farther from the reference (37 of 428, 8.6%, in PA; 10 of 85, 11.8%, in PFdl). In parentheses, the correlation r between indexes for up and down trials.
