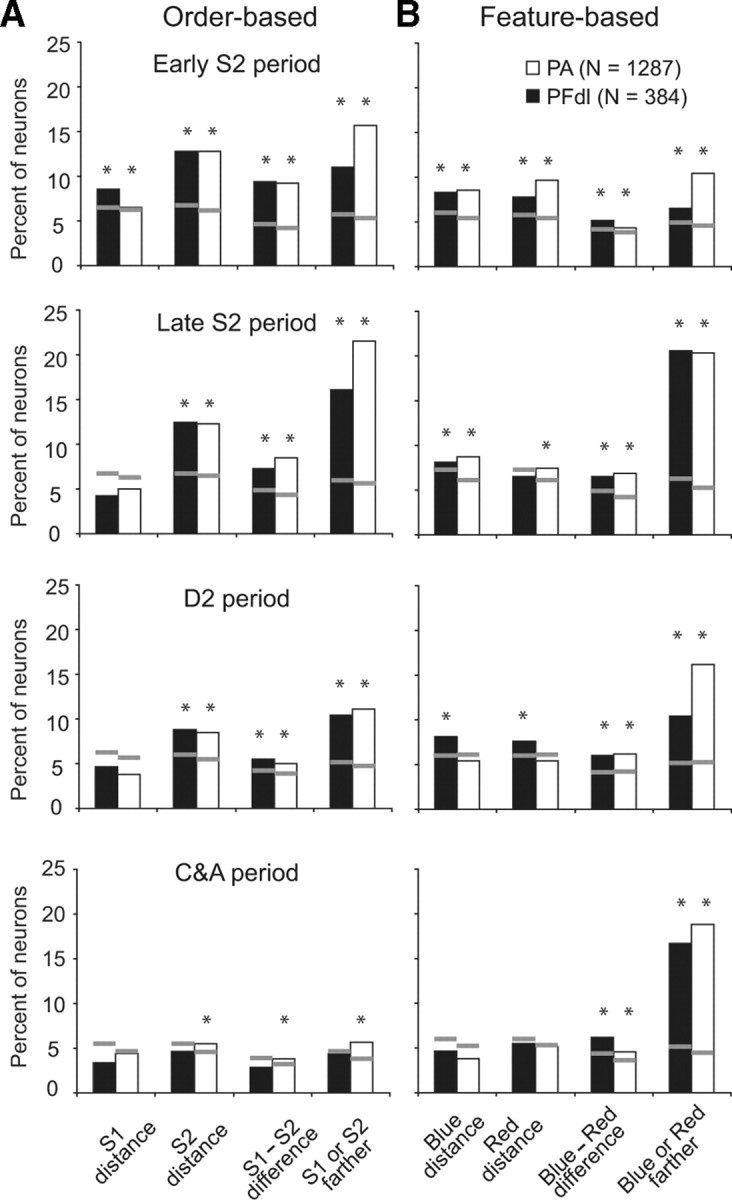
Figure 9.

Results of two separate four-factor, stepwise multiple-regression analyses. A, Order-based distance coding. B, Feature-based distance coding. The gray lines indicate chance level (p = 0.05) as calculated with Monte Carlo analysis. The asterisks above each histogram indicate a significant effect for that factor.
