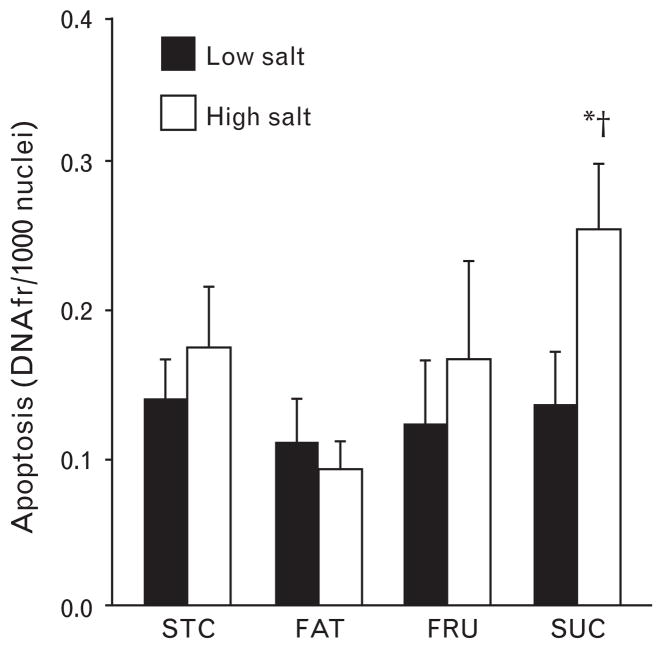
Fig. 3.
Levels of apoptosis as indicated by the presence of nuclear DNA fragmentation (DNAfr). Filled bars represent low-salt diets and open bars represent high-salt diets. *P <0.05 compared to the same dietary group with low salt. † P <0.05 compared to STC + S and FAT + S groups. Values are means ± SEM.

