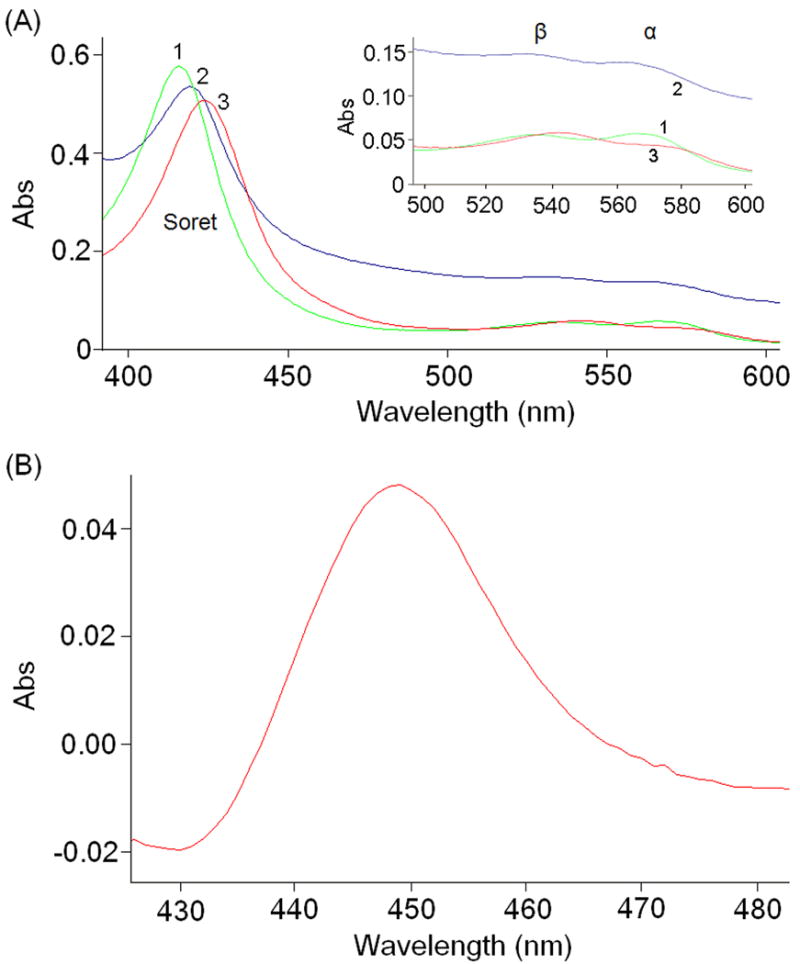
Figure 2.

UV-visible absorption spectra of Orf6*. (A) Curve 1 (green) shows the spectrum of substrate-free Orf6*; Curve 2 (blue), after reduction with sodium dithionite; and Curve 3 (red), after addition of imidazole. (B) The CO-difference spectrum of reduced Orf6* showing the characteristic absorbance at 450 nm.
