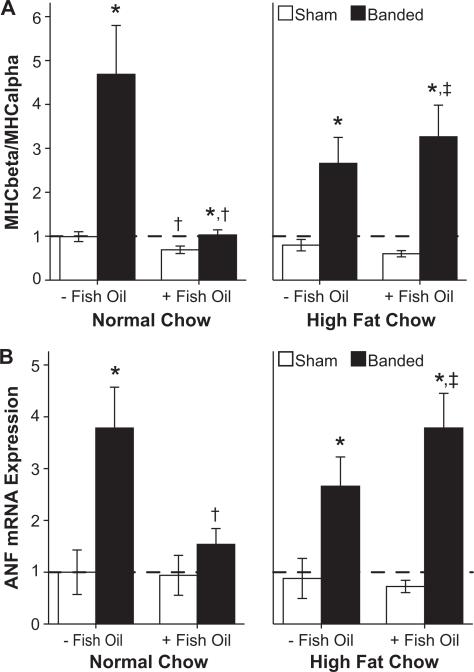
Figure 2.
Gene expression of (A) myosin heavy chain (MHC) isoforms and (B) atrial natriuretic factor (ANF; n=9 to 11 per group). *P≤0.05 vs respective sham, †P≤0.05 vs same diet without fish oil, ‡P≤0.05 vs respective normal low-fat diet. The hatched line marks the mean level for sham animals receiving standard chow without fish oil.

