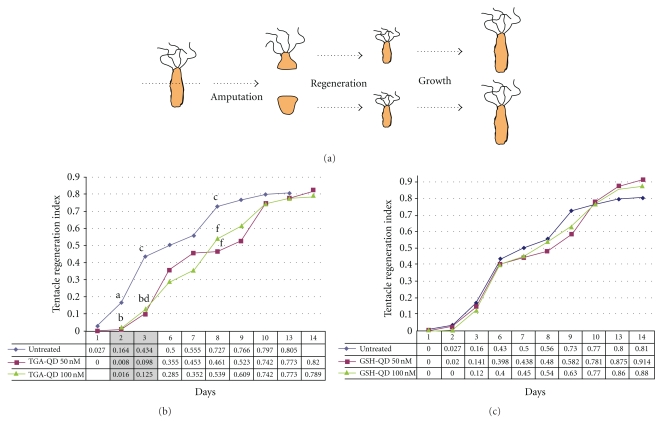
Figure 4.
Mean tentacle regeneration indices (TRI) plotted against corresponding days of regeneration. In (a), a scheme of the regeneration is illustrated. Groups of 4 Hydra treated with TGA-QD (b) or GSH-QD (c) were bisected and allowed to regenerate for 14 days. For each type of QD, two different concentrations were tested (50 nM, purple line, and 100 nM, green line) and compared to untreated regenerating Hydra. Mean TRI values with diverse letter are significantly different (unpaired t-test (P < .001)).

