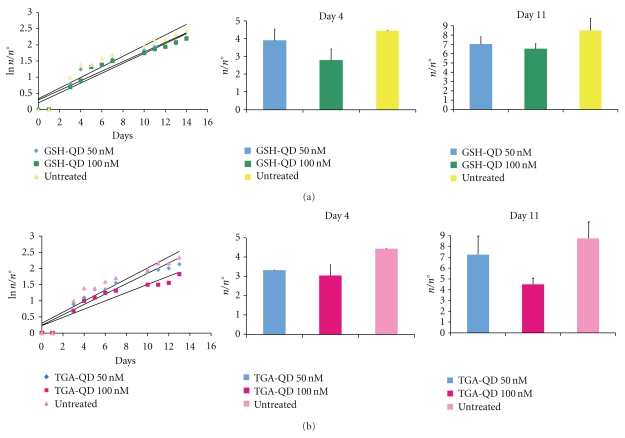
Figure 5.
Influence of the QD treatment on Hydra population growth rate. Population growth test started with a population of four full-grown Hydra, incubated 2 h with the indicated QD, washed out, and monitored every day for bud detachment. Hydra were treated with GSH-QDs, dark and light green bars, (a), or TGA-QDs, dark and light pink bars, (b), washed, and equilibrated in culture solution or not treated (blue bars). The individuals were inspected daily and counted under a stereomicroscope. The logarithmic growth rate constant (k) is the slope of the regression line using the standard equation of logarithmic growth: ln (n/n 0) = kt. Significant differences between growth rates of Hydra population treated with TGA-QD or untreated were obtained comparing linear regression slopes using ANOVA two-way test (P < .005). On the right panel, n/n° ratio (±SD) extrapolated from growth curves at days 4 and 11 is indicated.

