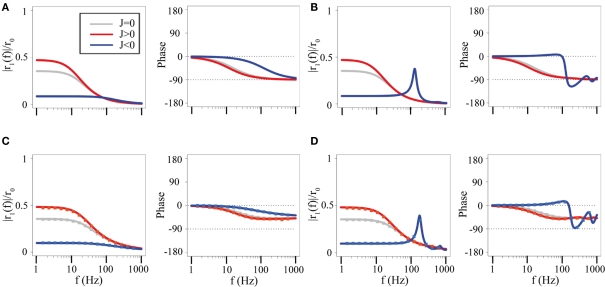
Figure 3.
Dynamics of one-population networks. Amplitude and phase shift of the network rate response to an oscillatory input at frequency f. (A) Rate model with no delays, τ = 10 ms. Gray line: unconnected network (J = 0). Red line: excitatory network (J = 0.25). Blue line: inhibitory network (J = −6.5). (B) Rate model with a delay, D = 2 ms. Otherwise same parameters as in (A). (C) Network of LIF neurons (τm = 10 ms, r0 = 15 Hz, σ = 5 mV) with no delay. Lines: analytical expression, Eq. (39); Squares: numerical simulations of a network of 2000 neurons. As in A, gray: unconnected network (J = 0 mV); Red: excitatory network (J = 5 mV); Blue: inhibitory network (J = −50 mV). (D) Network of LIF neurons with delay D = 2 ms. Other parameters as in (C).

