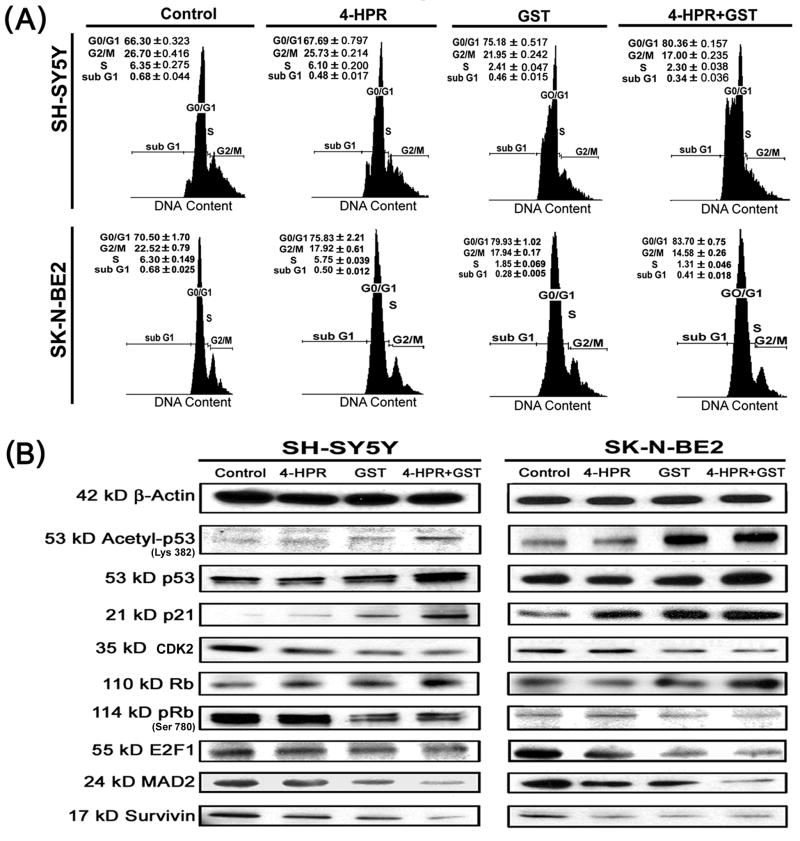
Fig. 3.
Cell cycle analysis and changes in levels of molecules governing the cell cycle. Treatments: control, 0.5 μM 4-HPR for 72 h, 25 μM GST for 24 h, and 0.5 μM 4-HPR for 48 h (pretreatment) + 25 μM GST for 24 h. (A) Flow cytometric analysis of cell cycle. Distributions of cells in the G0/G1, G2/M, S, and sub G1 phases were analyzed. (B) Representative Western blots to show changes in cytosolic levels of molecular markers associated with cell cycle arrest at G1/S phase. Expression of β-actin was used as a loading control. All experiments were conducted in triplicates.

