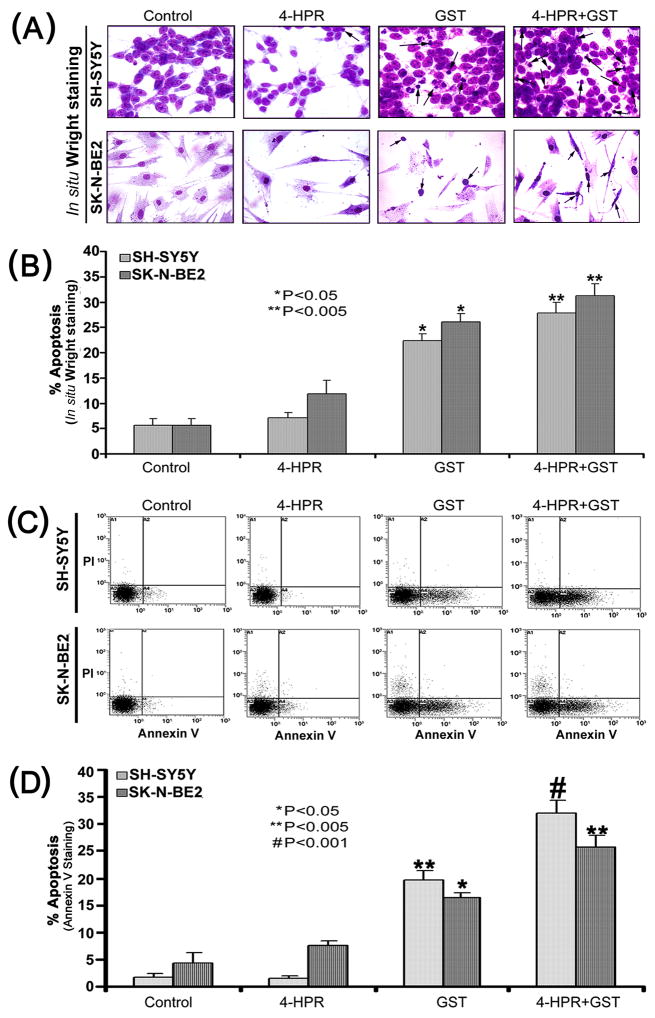
Fig. 4.
Determination of apoptosis in cells after the treatments. Treatments: control, 0.5 μM 4-HPR for 72 h, 25 μM GST for 24 h, and 0.5 μM 4-HPR for 48 h (pretreatment) + 25 μM GST for 24 h. (A) In situ Wright staining to examine morphological features of apoptosis. (B) Determination of percentages of apoptosis based on morphological features revealed by Wright Staining. (C) Annexin V staining and flow cytometric analysis of apoptotic populations after the treatments. Flow cytometric data presented here show only one of the three independent experiments in both SH-SY5Y and SK-N-BE2 cell lines. Combination of 4-HPR and GST induced significant population of cells in A4 area, indicating apoptotic death. (D) Determination of percentages of apoptosis based on accumulation of Annexin V positive cells in A4 area.

