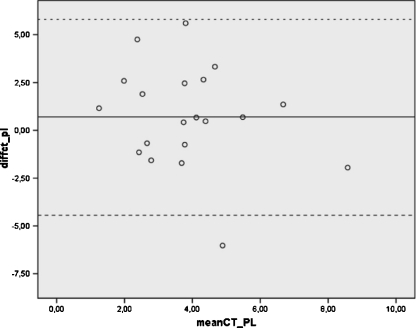
Fig. 5.
Bland-Altman plot shows the difference between intra- and postoperative computed tomography (CT) data against the average of the intra- and postoperative measurement values for each sample. The middle line is the mean difference and the two extreme lines are the +2 and −2 standard deviations

