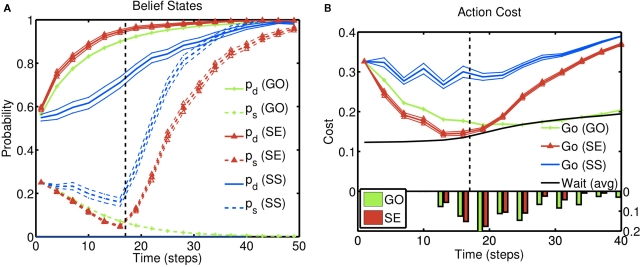
Figure 4.
Inference and action selection in the stop signal task. (A) Evolution of the belief state over time, on go trials (green), successful stop trials (SS; blue), and error stop trials (SE; red). Solid lines represent the posterior probabilities assigned to the true identity of the go stimulus (one of two possibilities) for the three types of trials – they all rise steadily toward the value 1, as sensory evidence accumulates. The dashed black vertical line represents the onset of the stop signal on stop trials. The probability of a stop signal being present (dashed lines) rises initially in a manner dependent upon prior expectations of frequency and timing of the stop signal, and subsequently rises farther toward the value 1 (stop trials), or drops to 0 (go trials), based on sensory evidence. (B) Average action costs corresponding to going (,see text) and waiting (, see text), using the same sets of trials as (A). The black dashed vertical line denotes the onset of the stop signal. A response is initiated when the cost of going drops below the cost of waiting. The RT histograms for go and error stop trials (bottom) indicate the temporal distribution of when the go cost crosses the stop cost in each simulated trial. Each data point is an average of 10,000 simulated trials. Error bar = SEM. Simulation parameters: qd = 0.68, qs = 0.72, λ = 0.2, r = 0.25, D = 50, cs = 0.2, cs = 0.004. See section 2 for definition of parameters. Unless otherwise specified, these parameters were used in all subsequent simulations.

