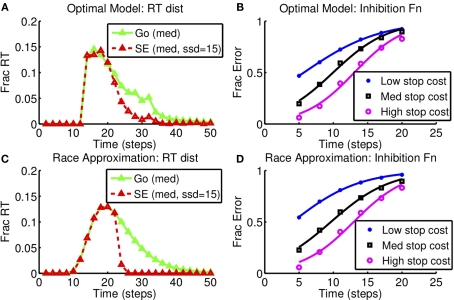
Figure 8.
Race model approximation to optimal decision-making as stop error penalty is varied: inhibition function and RT distribution. (A,B) Optimal model. (C,D) Diffusion race model. Left: RT distributions for GO and SE trials. SSD = 15, cs = 0.25, as in Figure 6. Right: Inhibition function for different stop error costs (low: cs = 0.15, med: cs = 0.25, high: cs = 0.5). Results based on 10,000 simulated trials from the optimal model, and also from the corresponding best-fitting diffusion race model.

