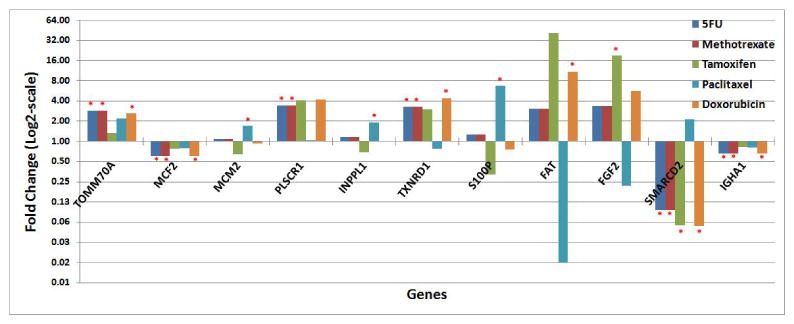
Figure 6.

Signature genes with significant differential expression in sensitive and resistant breast cancer cell lines for the studied anti-cancer agents. Fold change represents the gene expression ratio in resistant versus sensitive breast cancer cell lines. In the graph, statistically significant differential expression is marked by a red asterisk (*).
