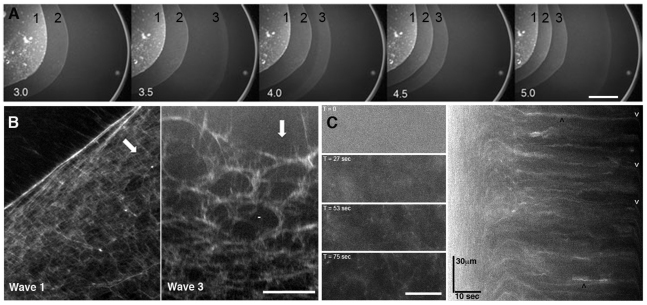
Fig. 2.
F-actin organization during gelation-contraction. (A) M-phase extract containing 0.3 μM actin labeled with tetramethylrhodamine on lysine residues (Kueh et al., 2008) imaged in sandwich format. The black numbers at the top refer to different waves of gelation-contraction. The white numbers indicate time (in minutes) at room temperature. (B) F-actin organization in the wave 1 and wave 3 of a M-phase extract imaged in sandwich format with fluorecin–Lifeact. White arrows indicate the direction of contraction. (C) A later wave in the same sample as in B imaged at higher magnification. The panels on the left-hand side are portions from four different frames of a time-lapse movie. The time (T) of image acquisition is shown in white. The panel on the right-hand side is a kymograph presentation of the entire time-lapse movie (in the same orientation as Fig. 1E). Black arrowheads indicate stationary cables of F-actin. White arrowheads indicate the time when contraction of the gel starts. All times are time elapsed from warming room temperature in minutes. Scale bars: 500 μm (A); 15 μm (B); 30 μm (C).

