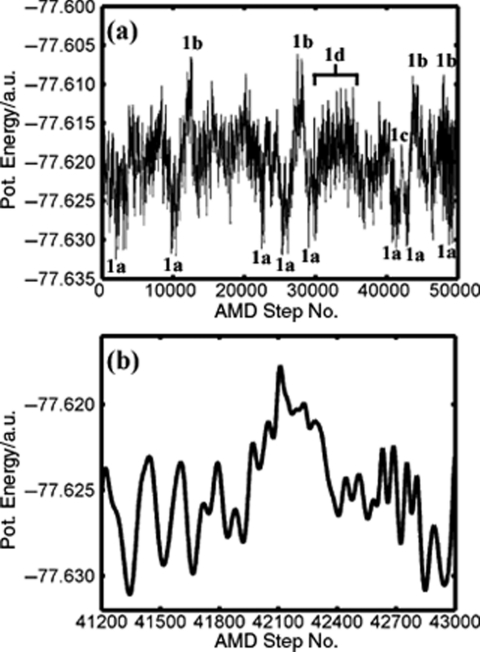
Figure 4.
(a) Variation of the underlying potential energy of FAD during the standard AMD simulation. The labels across the trajectory refer to the different states and motions depicted in Fig. 1. (b) Variation of the potential energy of FAD across the binary proton transfer event. The estimated energy barrier to DPT is ∼0.009–0.012 a.u. (5.7–7.5 kcal/mol).

