
Fig. 6.
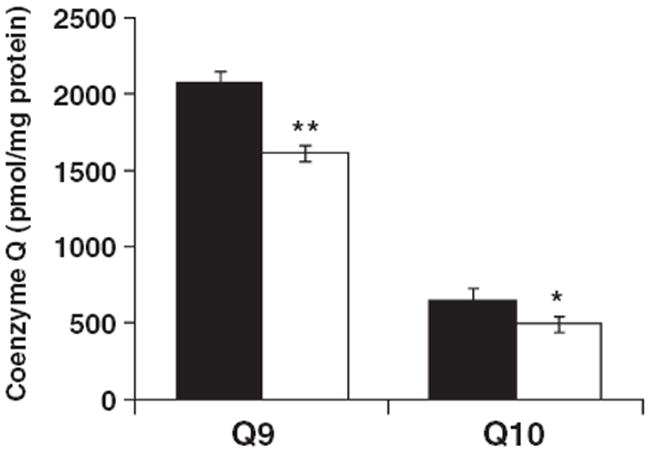
Coenzyme Q9 and Q10 content in NS (black bar) and Syn (white bar) mitochondria. Coenzyme Q content was measured by HPLC connected to an electrochemical detector as described in Materials and methods. The content of Q9 and Q10 were significantly lower in Syn mitochondria compared with NS mitochondria. Values are expressed as the mean pmol/mg protein ± SD (n = 3), where six cortexes were pooled for each sample. Asterisks indicate that the Q9 and Q10 values were lower in the Syn mitochondria than in the NS mitochondria at *p < 0.02 and **p < 0.001.