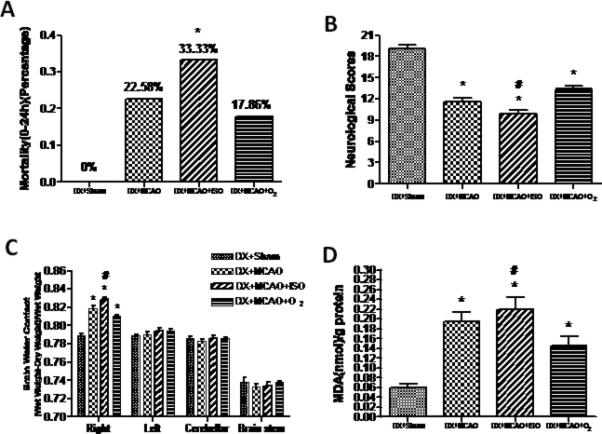
Figure 3.

Statistic analysis of mortality (A), neurobehavioral deficits (B), brain water content (C) and MDA content (D). Animals in the DX+MCAO+ISO group exhibited higher mortality, more severe neurobehavioral deficits, increased brain water content and MDA content compared to DX+MCAO+O2 group. Values are the mean ± SEM. *P<0.05 versus DX+Sham; #P<0.05 versus DX+MCAO+O2.
