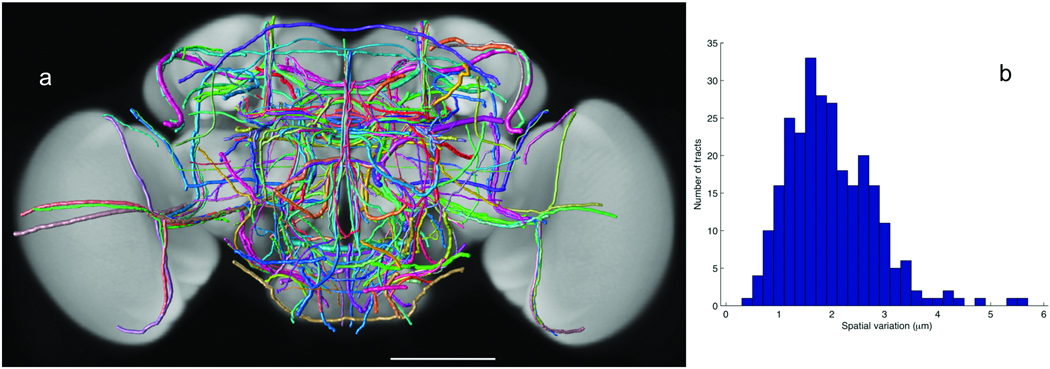
Figure 6.
A 3D atlas of neurite tracts reconstructed from aligned GAL4 patterns. (a) 269 stereotyped neurite tracts and their distribution in the brain. The width of each tract equals the respective spatial deviation. The tracts are color-coded randomly for better visualization. Scale bar: 100 µm. (b) Distribution of the spatial deviation of the neurite tracts.

