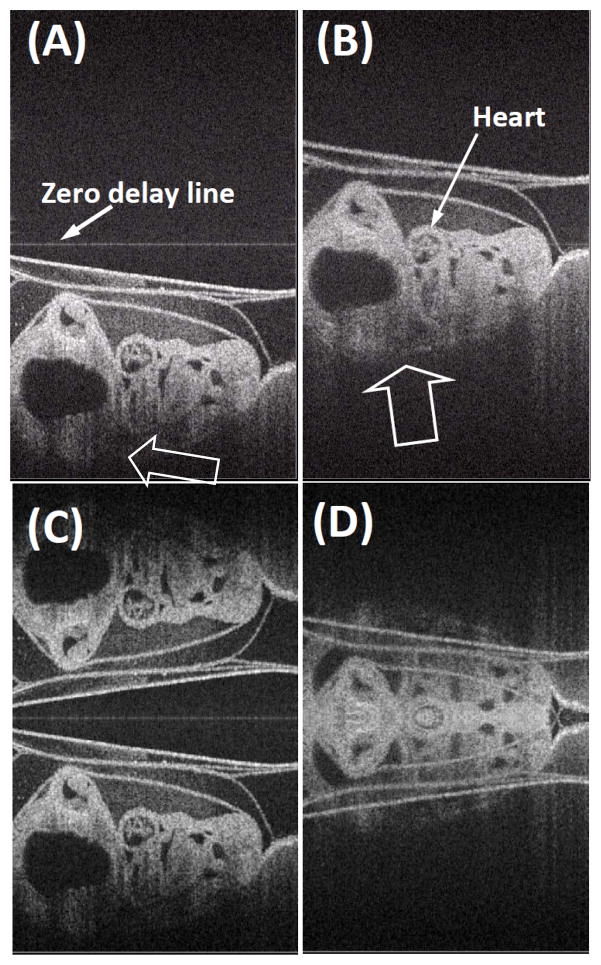
Fig. 7.
OCT images extracted from the real time videos of a chicken embryo. (A) and (C) were obtained from the experiment where the sample was placed under the zero-delay line. (A) Full range complex FDOCT approach, (C) FDOCT approach. (B) and (D) were obtained from the experiment that the sample placed cross the zero-delay line. (B) Full range complex FDOCT approach, (D) FDOCT approach. The physical size shown is 2.7 × 4.4 mm2 (lateral × depth). [See the associated movies]

