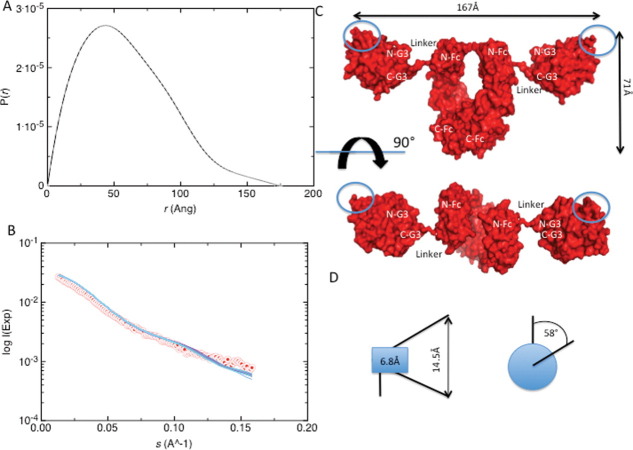
Figure 3.
SAXS and 3D domain structure. (A) Pair (or distance) distribution function [p(r)] and maximum dimension (Dmax) of the SAXS data of G3-Fc. Values were obatained using the program GNOM. (B) Plot of scattering intensity I(s) versus momentum transfer [s(Å−1)] for G3-Fc. Red colored dots represent raw data and superimposed blue coloured lines represent BUNCH fit data. The satisfactory value of 1.6 demonstrates the excellent agreement between raw data and BUNCH fit data. (C) Solution conformation of the G3-Fc in “surface” representation. N-G3 and C-G3 represent the N-terminus and the C-terminus of the G3 domain. N-Fc and C-Fc indicate the N-terminus and C-terminus of the Fc domain. (D) Schematic representation of the maximum displacement of individual BUNCH models. (Left) the 10-amino acid residue linker segments shows a transversal dislocation of 6.8Å (blue box) causing a maximum displacement of 14.5Å for the outer edge of the recognition surface of the G3 domain. (Right) The overall radius of gyration of the center of gravity for the recognition surface area is 58°. [Color figure can be viewed in the online issue, which is available at wileyonlinelibrary.com.]

