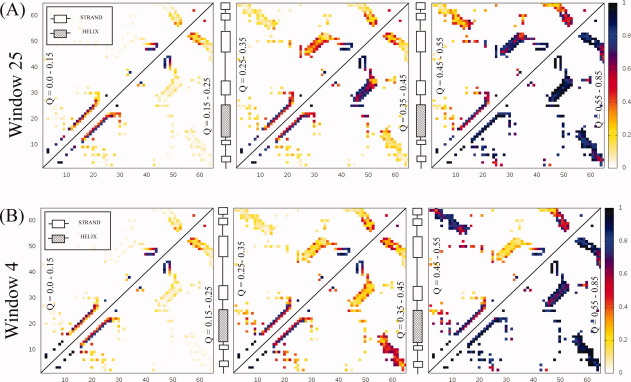
Figure 5.
Contact probability maps for CI-2 simulations (A) constraining residues 25-33 as a function of the reaction coordinate Q. The color bar indicates the probability that a contact is formed for structures with a Q-value shown inside the triangle. The sequence runs along both the x and y axes. The constraint stabilizes early interactions within the mini-core (strands 3/4). Contacting between the mini-core and helix forms next indicating that folding retains many features of the native pathway based on experimental results. (B) Constraining residues 4-12 as a function of the reaction coordinate Q. Early contacting between the termini is a result of constraining strands 1/2.

