
Figure 3.
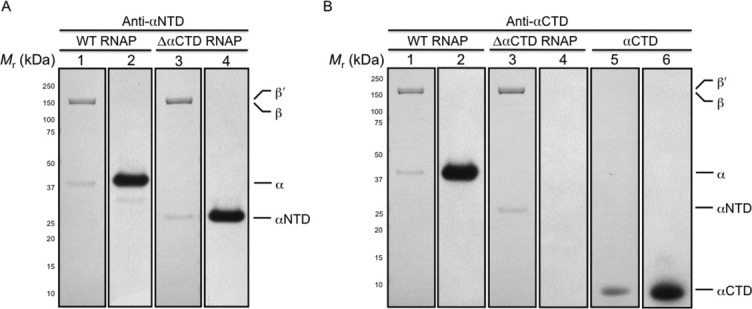
Western blot analysis of the in vivo-assembled, recombinant E. coli WT and ΔαCTD RNAP preparations. Purified recombinant RNAPs were fractionated by denaturing gel electrophoresis and electroblotted onto membrane. (A) The figure shows a membrane stained with amido black post-transfer of WT and ΔαCTD RNAP preparations and a photographic film developed after exposure to the membrane probed with anti-αNTD antibody and horse radish peroxidase conjugated anti-mouse IgG antibodies. Lanes were loaded as follows: (1) 1 μg of recombinant WT RNAP (membrane); (2) 1 μg of recombinant WT RNAP (photographic film); (3) 1 μg of recombinant ΔαCTD RNAP (membrane); (4) 1 μg of recombinant ΔαCTD RNAP (photographic film). (B) The figure shows a membrane stained with amido black post-transfer of WT RNAP, ΔαCTD RNAP and αCTD preparations and a photographic film developed after exposure to the membrane probed with anti-αCTD antibody and horse radish peroxidase conjugated anti-mouse IgG antibodies. Lanes were loaded as follows: (1) 1 μg of recombinant WT RNAP (membrane); (2) 1 μg of recombinant WT RNAP (photographic film); (3) 1 μg of recombinant ΔαCTD RNAP (membrane); (4) 1 μg of recombinant ΔαCTD RNAP (photographic film); (5) 1 μg of recombinant αCTD (membrane); (6) 1 μg of recombinant αCTD (photographic film). The membranes were calibrated with molecular mass standards ranging from 250 to 10 kDa; numbers at the side indicate the molecular mass values of the standards in kilodaltons, and arrows indicate bands due to α, αNTD, αCTD, β, and β′.