Figure 1.
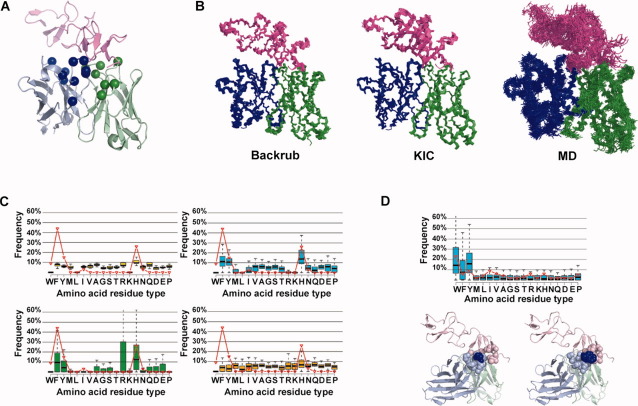
Comparison of flexible backbone protein design methods to predict the sequence tolerance in the Herceptin antibody interface with its target HER2. (A) Structure of the Herceptin antibody–HER2 complex (pink: HER2 C-terminal domain; green: antibody Fv light chain; blue: antibody Fv heavy chain; spheres: Cα atoms of the residues chosen for design). (B) Conformational ensembles generated by the backrub and KIC methods and MD snapshots. For clarity, only 20 snapshots were included in the MD ensemble depicted (100 ensemble members were used in simulations for all methods). (C) Comparison of the amino acid tolerance profile determined experimentally by phage display27 (red lines, library B) and predicted computationally using the different design protocols for position H91VL; shown are boxplots for the fixed backbone (yellow), backrub (cyan), KIC (green), and MD (orange) methods. (D) Upper: Comparison of the amino acid tolerance profile determined experimentally (red lines) and predicted computationally (boxplots) using backrub for the position D98VH; Lower: Mutation of residue D98VH on the Herceptin heavy chain from Asp to Trp likely increases packing interactions in the interface with HER2. Left panel: native structure of the Herceptin-HER2 complex (PDB 1nz8). Right panel: structural model of the lowest energy designed sequence for the top scoring backrub conformer. Residues located within 6 Å from the residue at position 98 (dark blue) are shown as spheres. Figures were made using Pymol http://www.pymol.org/.

