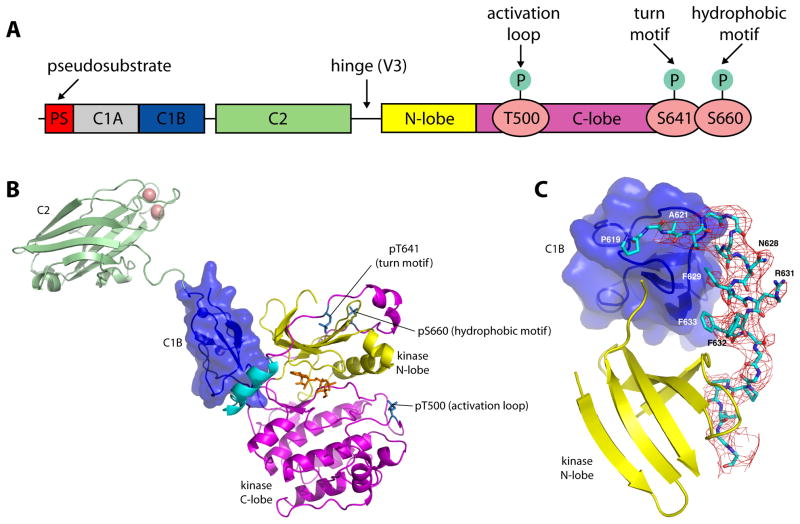
Figure 1. Structure of PKCβII.
(A) Schematic of the domain structure of PKCβII. (B) Structure of the ordered portion of full-length PKCβII, comprising the C1B (blue), C2 (green) and kinase domains. Magenta denotes the C-lobe, and yellow the N-lobe of the kinase domain. The NFD helix is colored cyan, calcium ions salmon, and AMPPNP orange. Phospho-Thr500, Thr641 and Ser660 are shown in a stick model. (C) Difference map (Fo−Fc) phased using a model subjected to a single pass of DEN-restrained refinement, prior to inclusion of residues 620-639. The map is contoured at 2σ.

