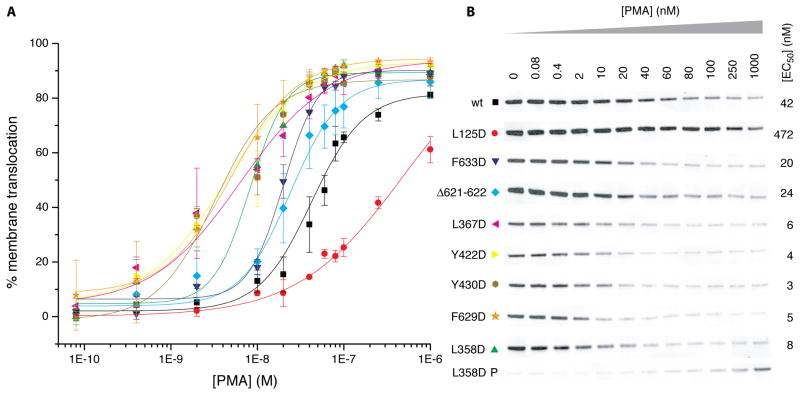
Figure 4. Mutational analysis of the C1B clamp in PKCβII translocation.
(A) Plot of in vivo membrane translocation of PKCβII against [PMA]. Data points are the mean of two measurements, and errors bars indicate the standard deviation from the mean. (B) PKCβII translocation was quantitated as the reduction in the cytosolic pool of PKC following exposure to PMA. Shown are the Western blots for wild type PKCβII and the indicated mutants. The intensity of the normalized bands is plotted in A. EC50 values are reported for each mutant. Both soluble cytosolic (S) and membrane pellet (P) fractions are shown for L358D.

