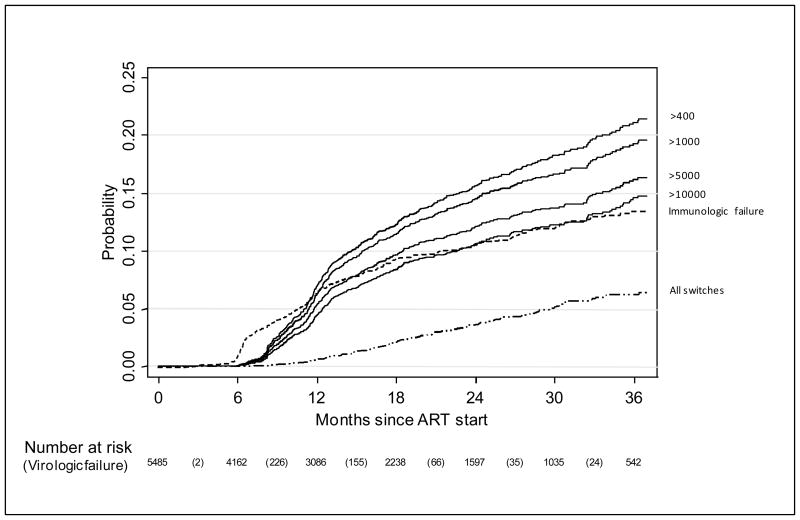
Figure 1.
Kaplan-Meier probability of virologic failure using different viral load values (measured in copies/ml) to define failure, as well as immunologic failure and switch.
Solid lines indicate virologic failure defined as two consecutive unsuppressed viral loads with the second viral load being above the threshold value indicated; dashed line indicates immunologic failure; dash-dot line indicates switch to second line.
Note: The numbers in parentheses in the risk table refer to virologic failure events defined as two consecutive viral load measurements >400 copies/ml with second viral load >1000 copies/ml and this is used as definition of failure in analyses.

