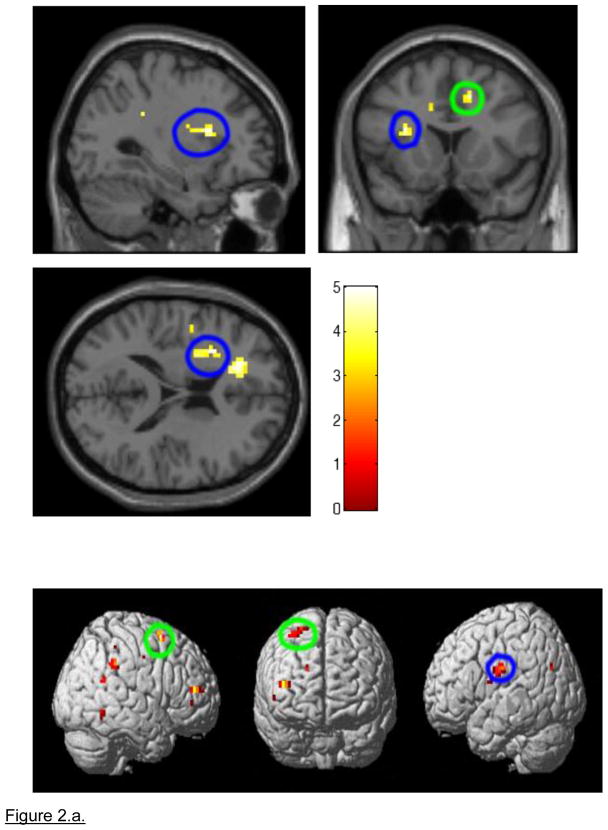
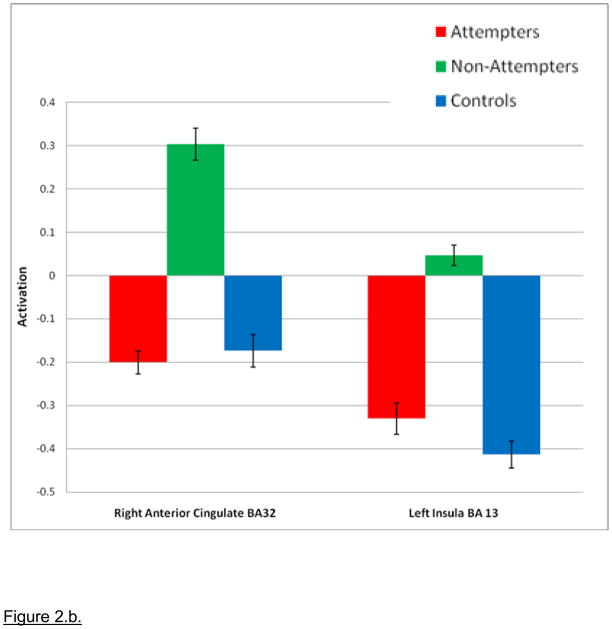
Figure 2.
a. Whole brain 3×2 Analysis of Variance (ANOVA) block-design NoGo response inhibition block analyses examining differences in neural activity in the GoNoGo response blocks covarying for age. Note: During GoNoGo blocks, Non-Attempters showed significantly greater activity than Attempters in the right anterior cingulate gyrus (p=0.008, encircled in green) and significantly greater activity than Healthy Controls in the left insula (p=0.004, encircled in blue). Green = Right Anterior Cingulate Gyrus; Blue = Left Insula. b. Non-Attempters > Attempters and Controls during the GoNoGo block. Note: 3×2 Analysis of Variance (ANOVA) Go No Go: Non-Attempters > Attempters and Controls. Magnitude of blood oxygen level dependent (BOLD) signal is depicted in the bar charts. Right Anterior Cingulate Gyrus: p= 0.008 Non-Attempters> Attempters; Left Insula: p= 0.004 Non-attempters>Healthy Controls.


