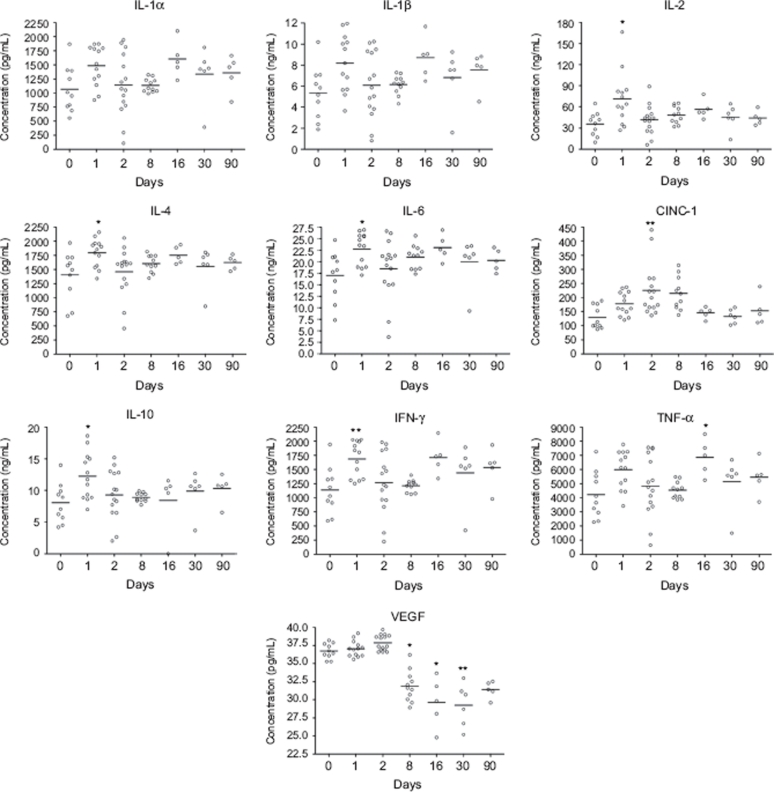
Figure 6.
Concentration of cytokines in serum from nano-TiO2 (5 mg/kg) exposed rats 0 (n = 10), 1 (n = 13), 2 (n = 15), 8 (n = 11), 16 (n = 5), 30 (n = 6), and 90 (n = 5) days after a single intratracheal instillation. Kruskal–Wallis test with Dunn's post-test; value is significantly (*P < 0.05, **P < 0.01) different vs. control.

