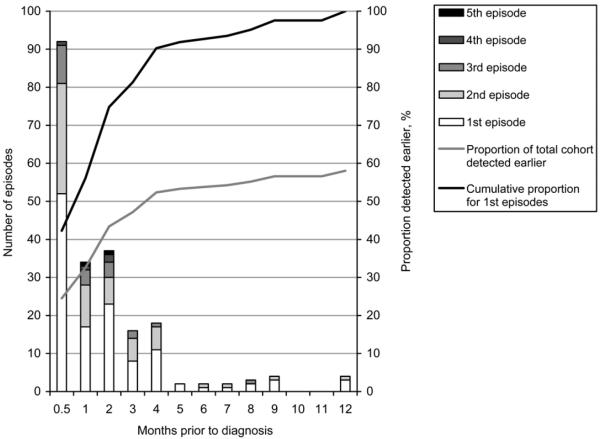
Figure 2.
Temporal distribution of first and subsequent missed opportunity episodes. The cumulative proportion of first episodes is shown. If all participants had been diagnosed on first presentation, this curve also represents the cumulative proportion of earlier diagnoses at any given time point. Thus, 56.1% of those with a delay in diagnosis would have been diagnosed within the 1 month prior to their diagnosis, and 74.8% within the preceding 2 months. The grey line shows the cumulative proportion for the first episodes of the total cohort, including the 89 who were diagnosed on first presentation. Again assuming TB had been detected on the first presentation of all participants, 32.6% of the total cohort would have been diagnosed up to 1 month earlier. At 2, 6 or 10 months prior to positive smear-based diagnosis, 43.4%, 53.8% or 56.6% of all participants would have been detected earlier.

