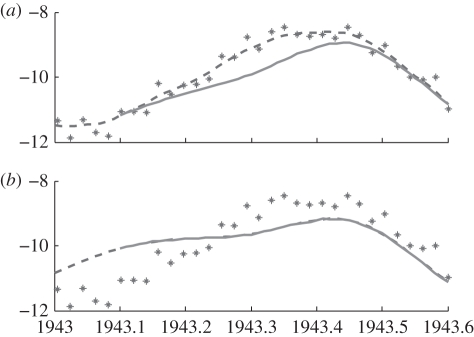
Figure 2.
An example of forwards cross-validation from a particular point, in this case t = 1943. Dashed lines represent the estimated trajectory. Solid lines show the solution to equations (2.3) starting at the estimated system state at t = 1943. Discrepancy between the data (stars) and the solid lines represent forwards prediction error. (a) With λ = 1 the estimated trajectory is close to the data, but the solution to equations (2.3) diverges quickly from the estimated trajectory. (b) With λ = 106 the solution to equations (2.3) remain near the estimated trajectory, but the estimated trajectory does not follow the data closely.

