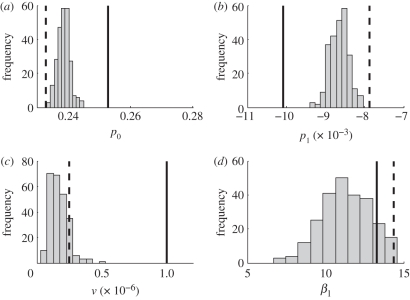
Figure 8.
Estimated parameter values from 250 stochastic simulations of the epidemic process (Gillespie algorithm). (a) reporting rate in 1952. (b) Yearly change in reporting rate. (c) Estimated visiting rate. (d) Linear year-to-year trend in β(t). Solid vertical lines give the parameter values used in generating the simulated data. Dashed lines give values estimated with a very large λ for an exact solution to equations (2.3).

