
Table 1.
Model parameters, ‘baseline’ values and the parameter value variation used in the sensitivity analysis.
| parameter | units | definition | ‘baseline’ value | −15% | +15% |
|---|---|---|---|---|---|
| a(t) | day−1 | birth-pulse function | — | — | — |
| atotal | yr−1 | total annual per capita birth rate | 5 | 4.25 | 5.75 |
| Bmean | — | mean birth date | 5 May | 1 January | 2 July |
| Bwidth | day | birth-pulse width | variable | ||
| Bstart | — | start of the parturition period | Bmean − Bwidth/2 | ||
| Bend | — | end of the parturition period | Bmean + Bwidth/2 | ||
| d | animal−1 d−1 | density-dependant mortality rate | 3.51 × 10⁻⁴ | 2.98 × 10⁻⁴ | 4.03 × 10⁻⁴ |
| σ | d−1 | latency rate | 0.045 | 0.038 | 0.052 |
| α | d−1 | disease-induced mortality rate | 0.08 | 0.068 | 0.092 |
| ϕ | d−1 | emigration rate for susceptible and exposed individuals | 0.025 | 0.021 | 0.029 |
| ψ | d−1 | emigration rate for infected individuals | 0.025 | 0.021 | 0.029 |
| β | animal−1 d−1 | transmission rate | 0.04 | 0.034 | 0.046 |
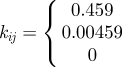
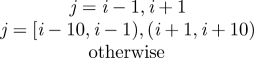
| kij | — | fraction of emigrants from j that move to i | 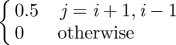 |
 |
 |