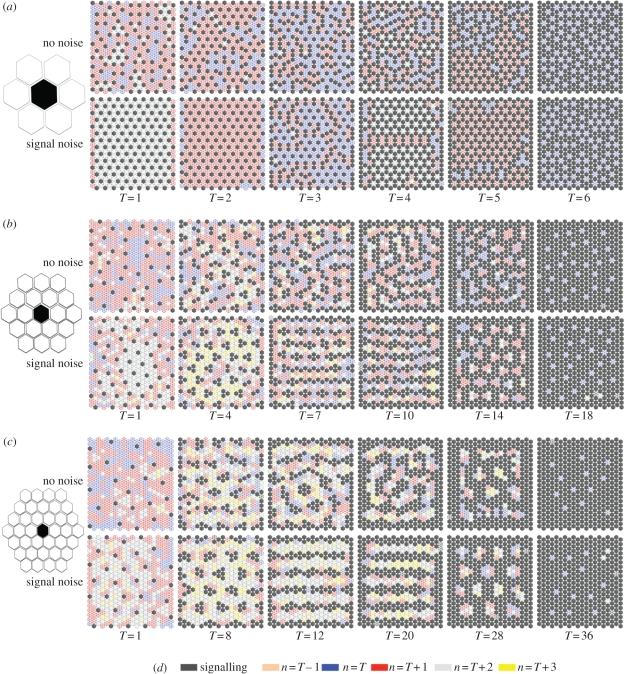
Figure 5.
At different signal ranges and inhibitory thresholds, a broad scope of patterns can be achieved. (a–c) Each panel shows typical results after 1000 steps for simulations of inhibitory signalling carried out in a 20 × 20 hexagonally packed array of cells. Different signal ranges were implemented, as illustrated by the size of the hexagonal shells positioned on the left ((a) one cell, (b) two cells and (c) three cells). For each signal range, a selection of inhibitory thresholds is shown with and without temporal noise, Nt = 0.01. The active signalling cells and the neighbourhood of inactive cells are identified according to the key in (d). It is clear from this illustrative set of examples that different patterns are achievable ranging from spots through to stripes that may be in some cases realigned by the input of signal noise (e.g. (b), T = 10).

