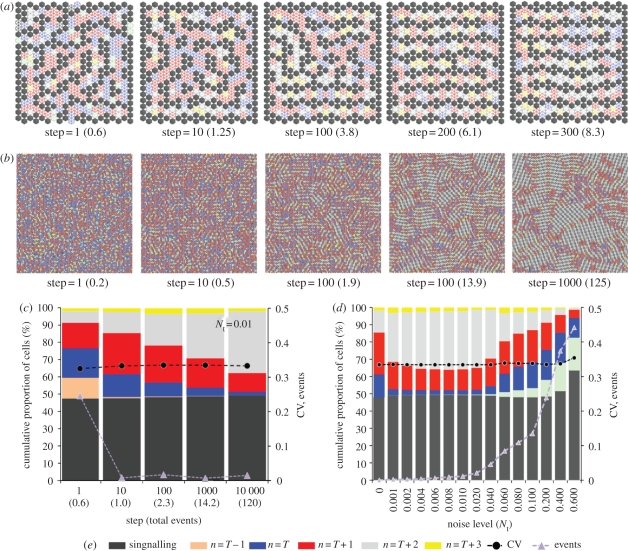
Figure 6.
Patterns of stripes align owing to signal noise. (a,b) Simulations of inhibitory signalling with a signalling range of two cells, an inhibitory threshold, T = 9, and temporal signalling noise, Nt = 0.01. The active signalling cells and the neighbourhood of inactive cells are labelled according to the colour key in (e). The number of simulations steps and total events (in brackets) is shown progressing from left to right. In (a), where a small array of 20 × 20 cells was used, the initial pattern of randomly orientated stripes can be seen to align, over time, with the array boundaries where there is no signal. In (b), where a larger array of 100 × 100 cells (with toroidal boundaries) was used, distinct zones of aligned stripes are formed as a result of the signalling noise. See also the electronic supplementary material, movie 2. (c) Graphical visualization of the patterning process. The figure shows the cumulative proportion of each cell type (as defined in the colour key in (e)) obtained from data averaged over 10 simulations with the conditions specified in (b). The process of stripe alignment correlates with a transition from n = T and n = T + 1 cells to n = T + 2 cells. Also plotted are the number of events per time step and the CV in the pattern spacing. With stripe alignment there is no change in the CV of the pattern spacing. (d) A comparison of the final pattern state achieved after 10 000 steps with different amounts of signal noise. The figures show the mean values obtained after 10 simulations at a signal range of two cells and a threshold, T = 9. Optimized patterns are achieved with noise levels in the range 0.001 < Nt <0.01. Similar results (data not shown) were obtained when spatial noise was used instead of (or in addition to) temporal noise. NB: Standard errors (95% confidence intervals) in the mean values plotted in (c,d) were less than 1% (left-hand y-axis) and less than 0.01 (right-hand y-axis) and so were not visible on this scale.

