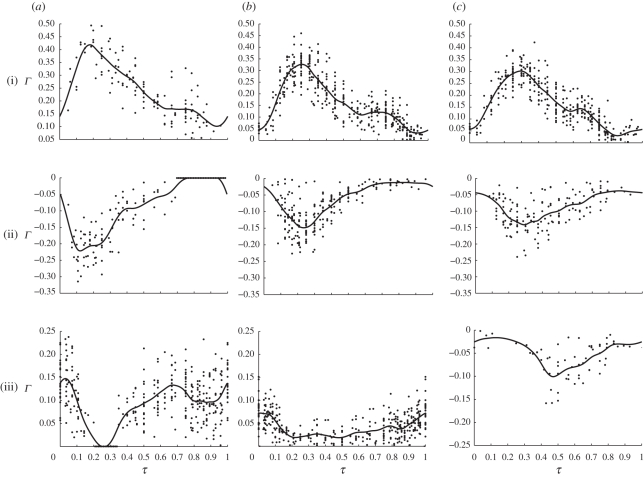
Figure 6.
Circulation over the wingbeat in wingtip vortex, wing root vortex and tail vortex. The cubic smoothing splines used when calculating forces from the model are plotted in each panel. Circulation in sections within wingbeat that contain no data because the structure in question was not visible has been set to zero. (a) shows the results for 5.7 m s−1, (b) shows results for 7.7 m s−1 and (c) shows results for 9.9 m s−1. (i) shows wingtip circulation, (ii) shows wing root circulation and (iii) shows tail circulation. In all plots, x-axis corresponds to phase in wingbeat (0 is beginning of downstroke, 0.25 mid-downstroke, 0.5 end of downstroke, 0.75 mid-upstroke and 1 end of upstroke) and y-axis circulation (Γ).

