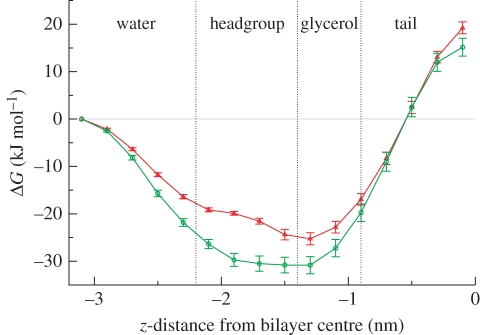
Figure 2.
Free energies of transfer from water to selected z-distances along the bilayer normal. To facilitate interpretation, different regions across the system have been marked, namely the bulk water region, the lipid headgroup region, the lipid glycerol region and the hydrocarbon tail core. Approximate boundaries between these regions are defined by the vertical dotted lines (red, TCS; green, TCC).

