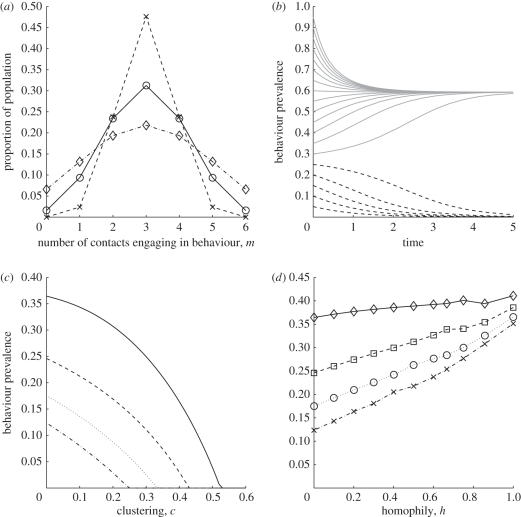
Figure 1.
Numerical results for the behavioural model. Parameters n = 6, a = 3 are common to all figures. (a) Proportion Dm for the baseline, binomial model (circles), in addition to the clustered distribution with c = 1/3 (diamonds) and the homophily model with h = 2/3 (crosses). (b) Temporal dynamics of a complex contagion with τ = 1.8, c = h = 0. Depending on the initial prevalence of behaviour, both the ‘behaviour-free’ (dashed lines) and ‘established behaviour’ (solid line) steady states can be reached, and are stable. The phase space of complex contagion is also shown for (c) clustering (solid line, τ = 1.5; dashed line, τ = 2; dotted line, τ = 3; dashed-dotted line, τ = 5) and (d) homophily (diamonds, τ = 1.5; squares, τ = 2; circles, τ = 3; crosses, τ = 5). For given values of τ, c and h, different curves show the minimum values of behaviour prevalence that are needed for the system to evolve towards the ‘established behaviour’ steady state.

