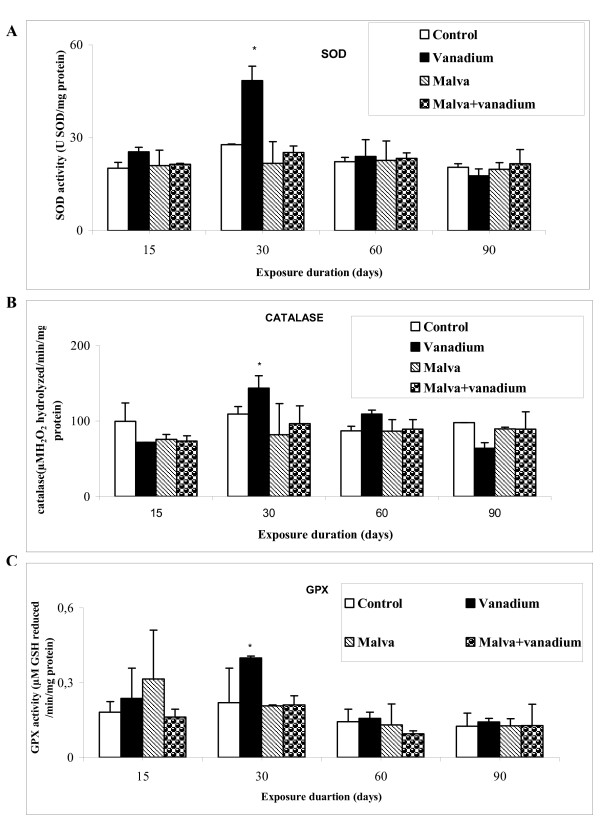
Figure 4.
Activities of some enzymes in controls and treated rats after 15, 30, 60 and 90 days. (A) Superoxide dismutase (SOD), (B) catalase (CAT) and (C) Glutathione peroxidase (GPX). Values are the mean ± SD, normalized to 100 for controls (n = 5). Student's test was used for comparison: * (p < 0.05)

