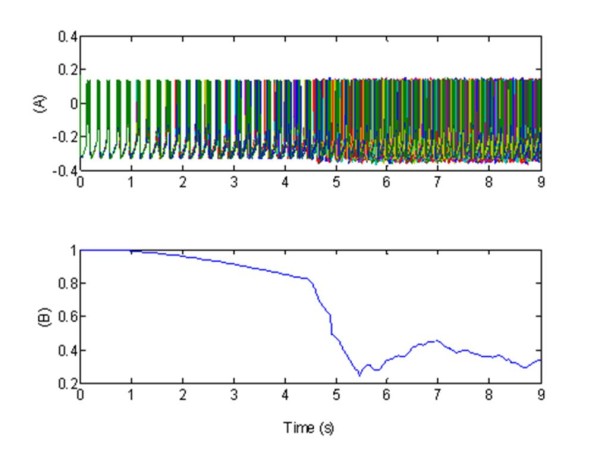
Figure 4.

Effect of a simulation of the standard high-frequency deep brain stimulation, via one central electrode, in terms synchronized activity of the coupled population of 100 neurons. (A) Bursting pattern during the excitatory stimulation of all the membrane potentials vj(t). These show the characteristic synchronized (before stimulation) and desynchronized (after stimulation) bursting activity; (B) Synchronization measure R given by Eq. 13. In plots (A-B), the stimulation signal W(t), (see Figure 2), was formed by a 130 Hz pulse train composed of biphasic pulses (0.2 ms positive followed by 3 ms negative stimulation). The stimulation was supplied via one electrode situated in the central part of the network. Parameters: X1= 1 for t ∈ [4.5, 9]s, excitatory stimulation; X1 = 0, elsewhere,
