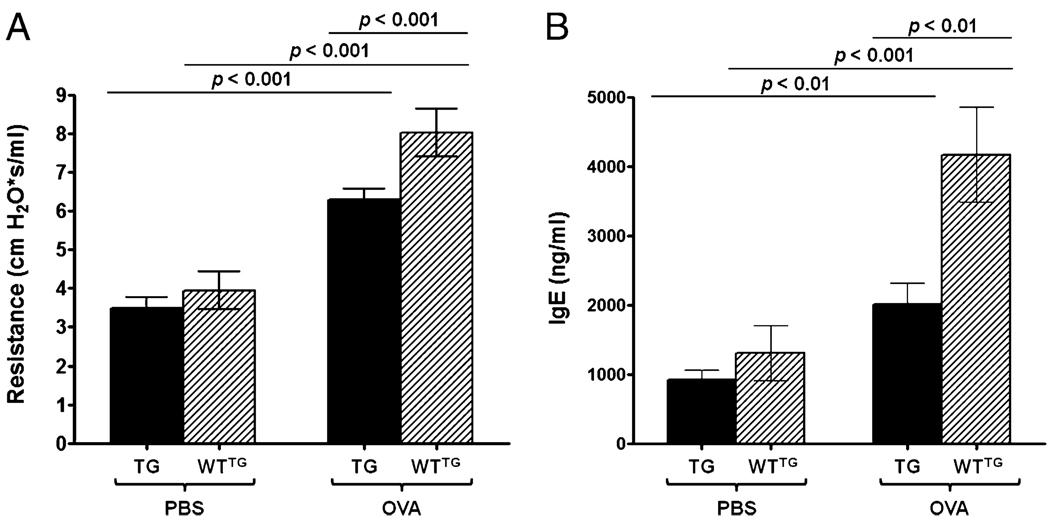
FIGURE 1.
Airway resistance and IgE levels in plasma from SLPI TG and WTTG mice. Bars represent the mean ± SEM of five independent experiments (n = 15 per group). A, Airway resistance. B, IgE levels in plasma. TG-OVA mice showed statistically significantly lower lung resistance and IgE levels in plasma compared with WTTG-OVA mice.

