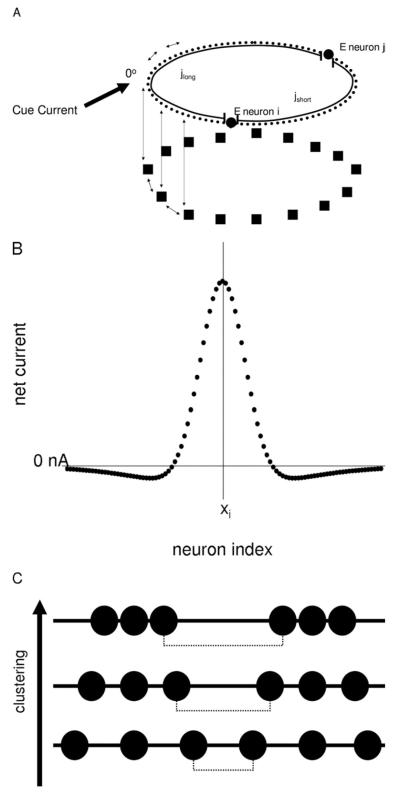
Figure 1.
(A) Schematic of the model. Model neurons are recurrently connected (double arrows) within and between the E neuron (circles) and I neuron (square) layers. Synaptic weights between neurons are governed by the “short” (jshort) and “long” (jlong) distances between neurons on the ring structure. During the saccade tasks, an external cue current is fed into the E neuron layer as depicted. (B) Example of the effective current distribution from E neuron xi to neurons within the E layer that results from activating neighboring E and I neurons. (C) Example of neuron spatial distributions during clustering simulations. Black circles represent E neurons as in (A). The dashed line represents the maximum nearest-neighbor distance (dfar) between neurons. As clustering is increased, dfar is increased while the minimum nearest-neighbor distance (dnear) is decreased. E, excitatory; I, inhibitory.

