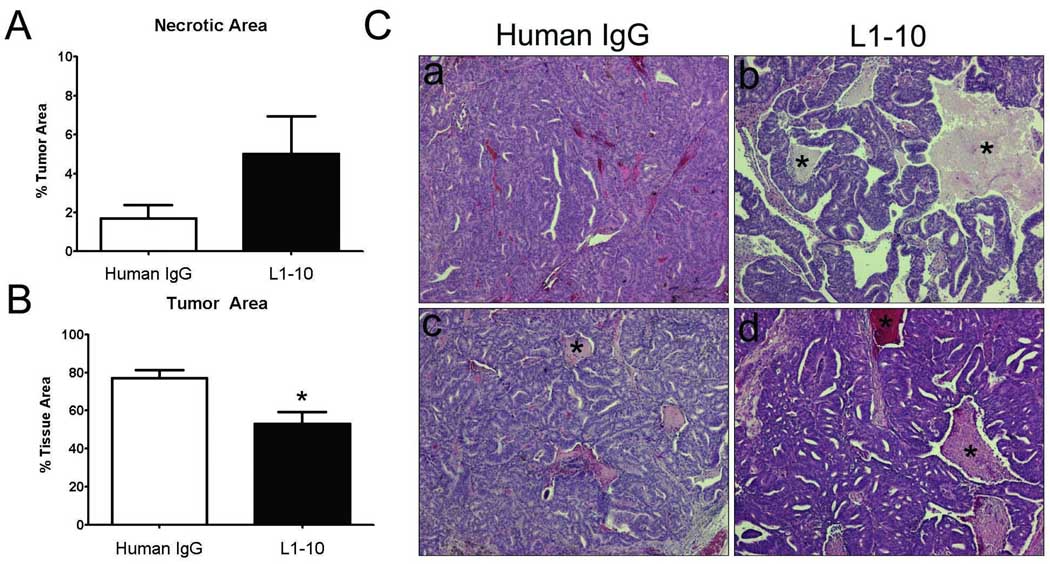
Figure 2. Histomorphometric analysis reveals a decrease in tumor area and an increase in necrotic regions of L1–10 treated LuCaP 23.1 subcutaneous xenografts.
(A) Histomorphometric analysis of necrotic area as a % of tumor area in control and L1–10 treated LuCaP 23.1 subcutaneous tumors. (B) Histomorphometric analysis of tumor area in control and L1–10 treated LuCaP 23.1 subcutaneous tumors * (p=0.0063). (C) Representative images of control and L1–10 treated LuCaP 23.1 subcutaneous tumors. * Highlights necrotic regions. For all experiments: control (n=9) and L1–10 treated (n=9). Results are plotted as mean ± SEM.

