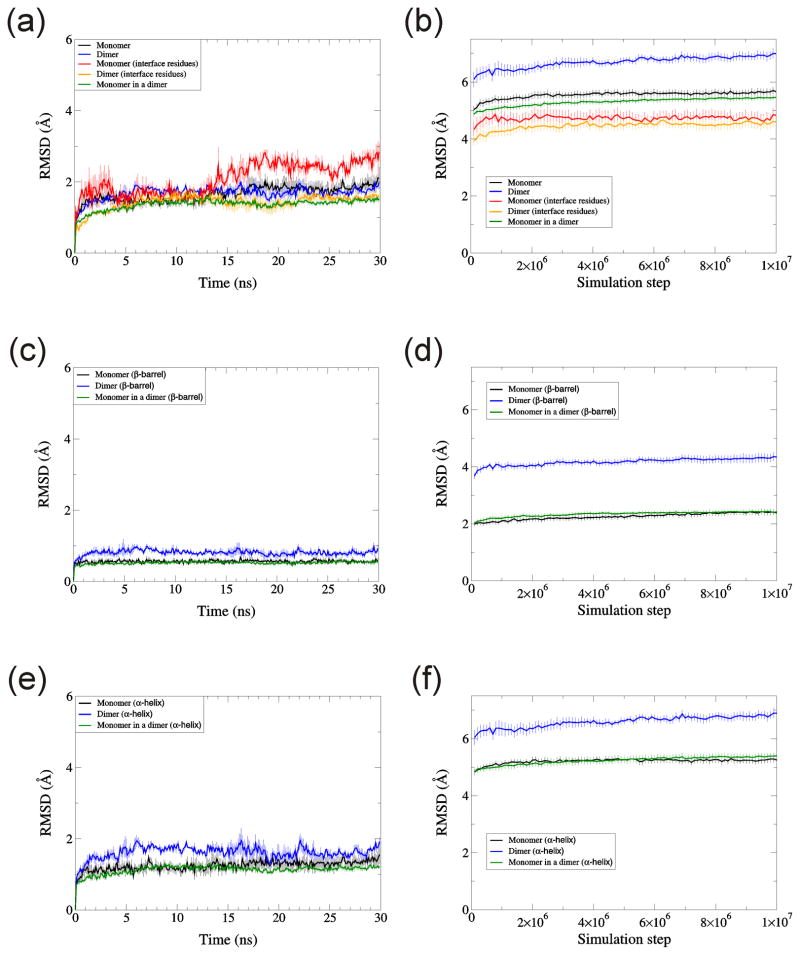
Fig. 13.
RMSD for monomeric and dimeric TIM. RMSD of Cα atoms are calculated for (a, b) whole protein, (c, d) β-barrel residues, and (e, f) α-helix residues. Simulations were performed by (a, c, e) NAMD and (b, d, f) DMD. Temperature was 310K for NAMD, and 0.08 for DMD. Each data point is the average over three trajectories for NAMD and ten trajectories for DMD. Error bars denote standard error.

