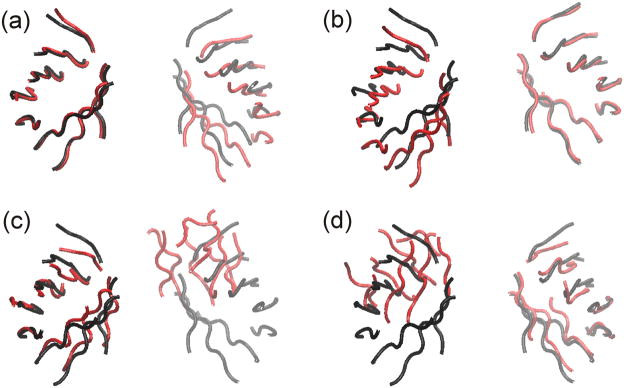
Fig. 14.
Representative β-barrel structures of TIM dimer simulations. Black shows a TIM crystal and red for simulated structures. (a, b) NAMD at 30 ns averaged over three trajectories and (c, d) DMD at 10 millionth step averaged over 10 trajectories. Crystal and simulated structures were geometrically aligned for (a, c) left β-barrels and (b, d) right β-barrels. Depth cueing was used.

