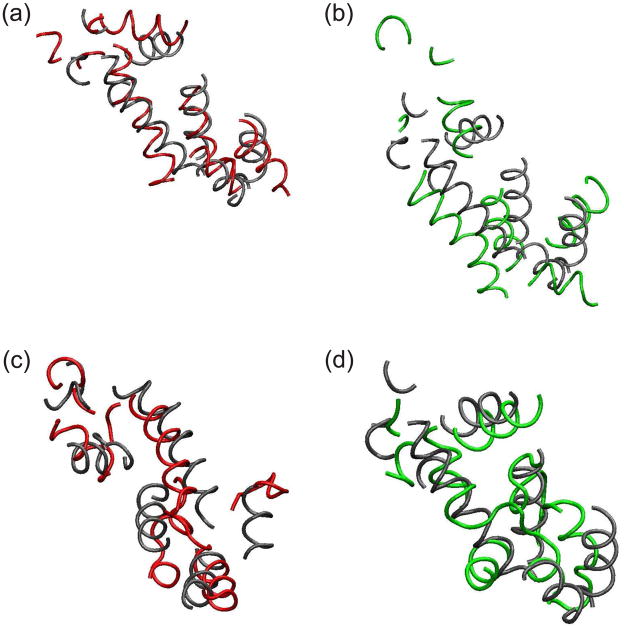
Fig. 8.
Typical conformations with a crystal structure and simulated structures started from incorrectly folded initial structures on RGS4. Core conformations at 30 ns of NAMD with (a) 1up (red) and (b) 2up (green) superimposed by its known structure (grey). Core conformations at 10 millionth step of DMD with (c) 1up (red) and (d) 2up (green) superimposed by its known structure (grey).

