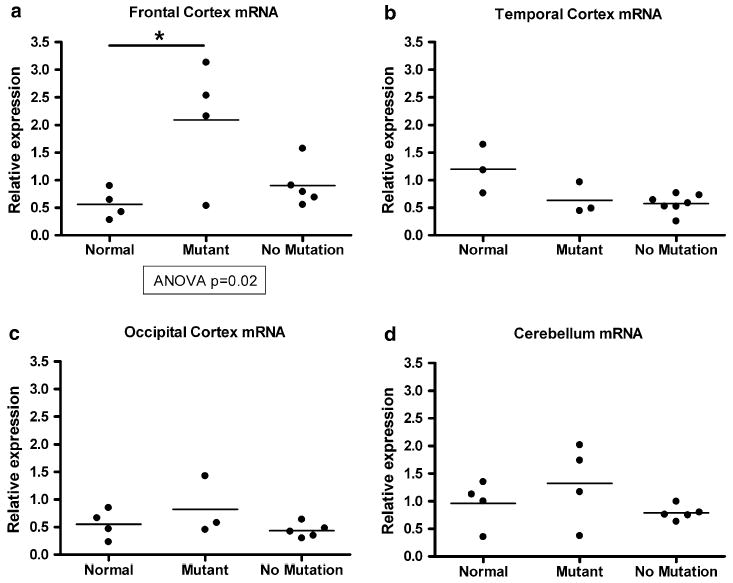
Fig. 1.

Quantification of GRN mRNA transcript levels from brain samples in normal controls (normal), FTLD-TDP with GRN mutations (mutant), and FTLD-TDP without GRN mutations (no mutation). a Quantitative reverse transcription PCR (QRT-PCR) shows that GRN mRNA is increased in frontal cortex samples from FTLD-TDP cases with GRN mutations; increase relative to normal control is significant (P < 0.05). b–d QRT-PCR shows equivalent amounts of temporal cortex, occipital cortex, and cerebellar GRN mRNA in normal controls and FTLD-TDP with and without GRN mutations. QRT-PCR reactions were performed in duplicate, standardized to the geometric mean of two housekeeping genes (cyclophilin A and β-actin), and normalized to control. Individual cases are shown as circles, and the mean for each group is shown as a bar. ANOVA was used to evaluate progranulin mRNA levels across groups, followed by Tukey’s test for pairwise comparisons
