
Fig. 2.
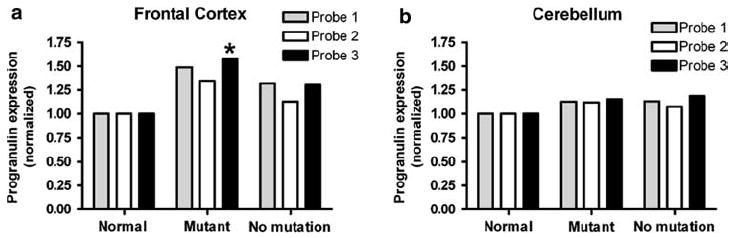
Microarray analysis corroborates QRT-PCR results.a Microarray analysis demonstrates that frontal cortex from GRN mutants (mutant, n = 6) have elevated GRN mRNA relative to controls (normal, n = 8) and FTLD-TDP without GRN mutations (no mutation, n = 10). GRN is represented by three different probes on the Affymetrix U133A microarray used. For probe 3 (*), GRN mutation cases show a significant elevation (P = 0.04) relative to normals. P value corrected for multiple-hypothesis testing by the Benjamini–Hochberg method. b Cerebellar samples from normal controls (n = 8), FTLD-TDP with GRN mutations (n = 5), and FTLD-TDP without GRN mutations (n = 8) show equivalent amounts of GRN mRNA by microarray